
New polls were published last week and indicated that many B.C. voters seem to appreciate John Horgan's handling of the pandemic so far. The Angus Reid Institute released its latest round of Premier approval ratings across the country (9 of 10 provinces) and John Horgan jumped 25 points since February, now at 71 per cent approval from B.C. voters - in third place behind Higgs (NB) and Legault (Qc). See Angus Reid's poll report here.
As part of its latest round of B.C. polling, Research Co. took the pulse of B.C. voters and has measured the NDP in first place of voting intentions with 41 per cent. The BC Liberals were second with 33 per cent. Regionally, Research Co. has the NDP leading in Metro Vancouver and Vancouver Island by double-digits, and in a close race with the Liberals in the Fraser Valley. See Research Co.'s full report here. (Research Co. has also published several very interesting polls other than voting intentions of late, so I encourage readers to check out their feed - including one recent survey about vaccines.)
Here are the updated 338Canada B.C. popular vote projections:
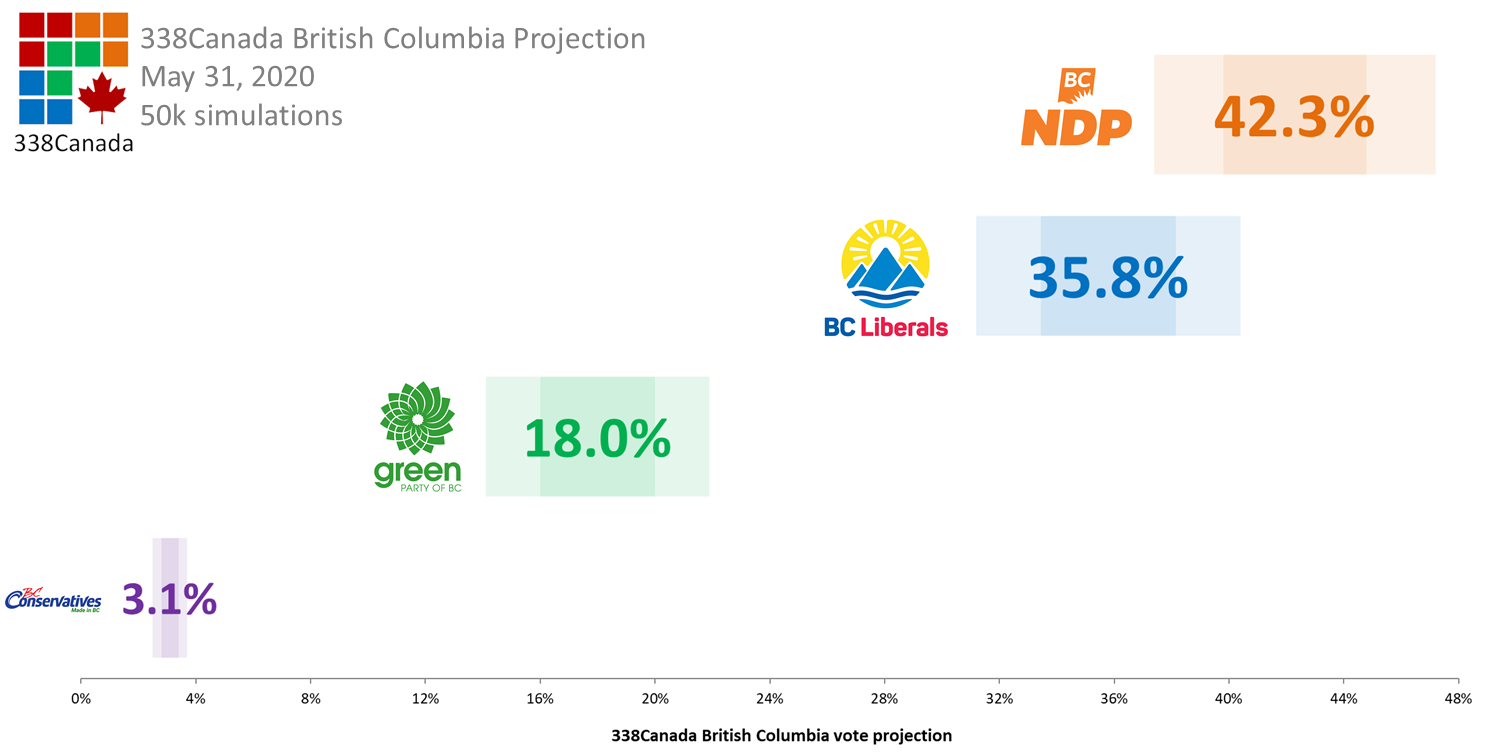
The NDP has opened some breathing room between itself and the B.C. Liberals, but with the little data that has been made available in the past months, the uncertainty in these projections remain important. However, from the dead heat that was the 2017 provincial election, it appears the NDP support has remained mostly stable - unlike the Liberals -, which gives Horgan and his team an certain edge.
That edge is certainly showing in the seat projections, where the NDP wins an average of 49 seats, five seats above the majority threshold at the B.C. Legislative Assembly. When we break down the numbers by electoral district, the 338Canada model counts 24 ridings labelled as "safe" for the NDP, double the amount of safe seats the Liberals, which gives the NDP the highest floor of seats.
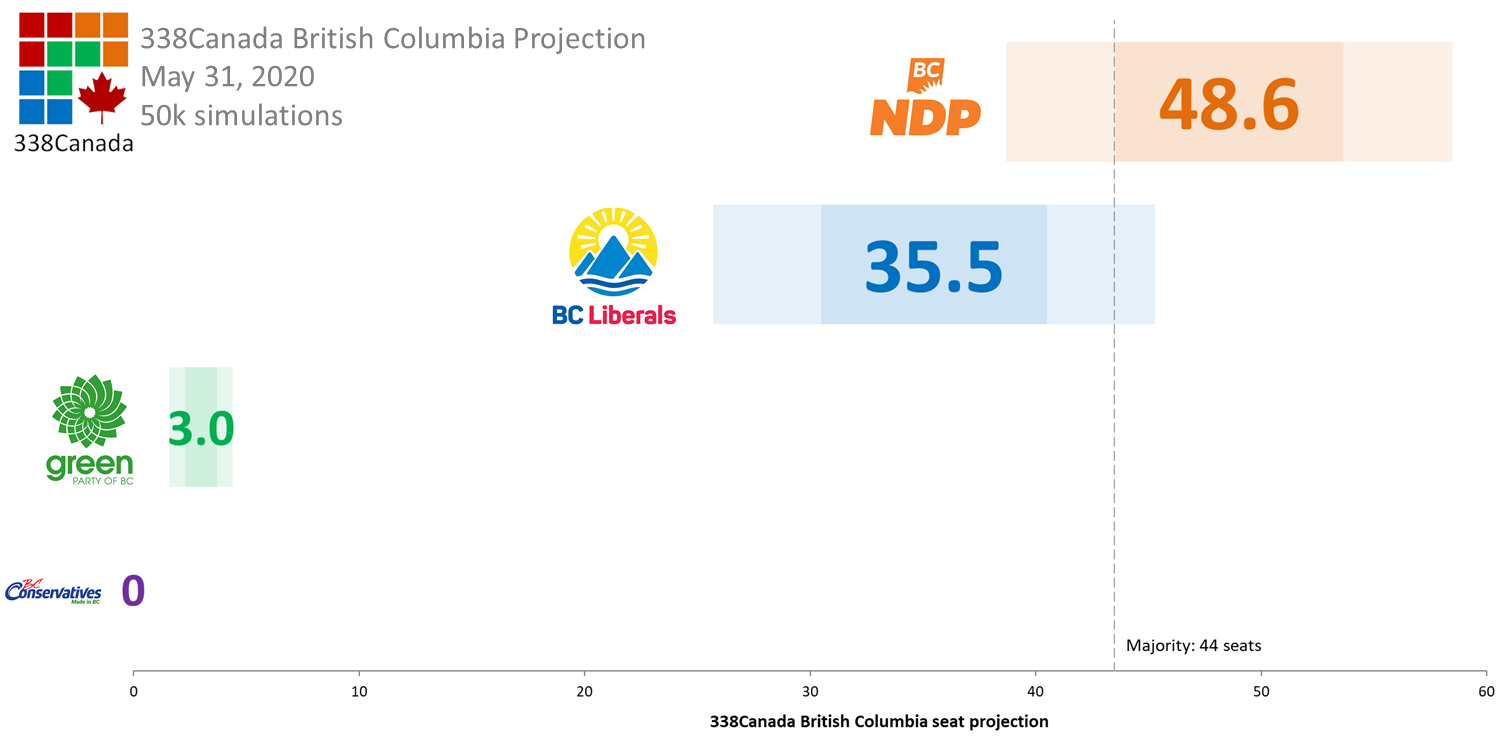
The Liberals win an average of 35 seats in the general election simulations, eight fewer than its 2017 election result. Thte B.C. Green Party is projected ahead in the three electoral districts it won back in 2017 (Cowichan Valley, Saanich North and the Islands, and Oak Bay-Gordon Head).
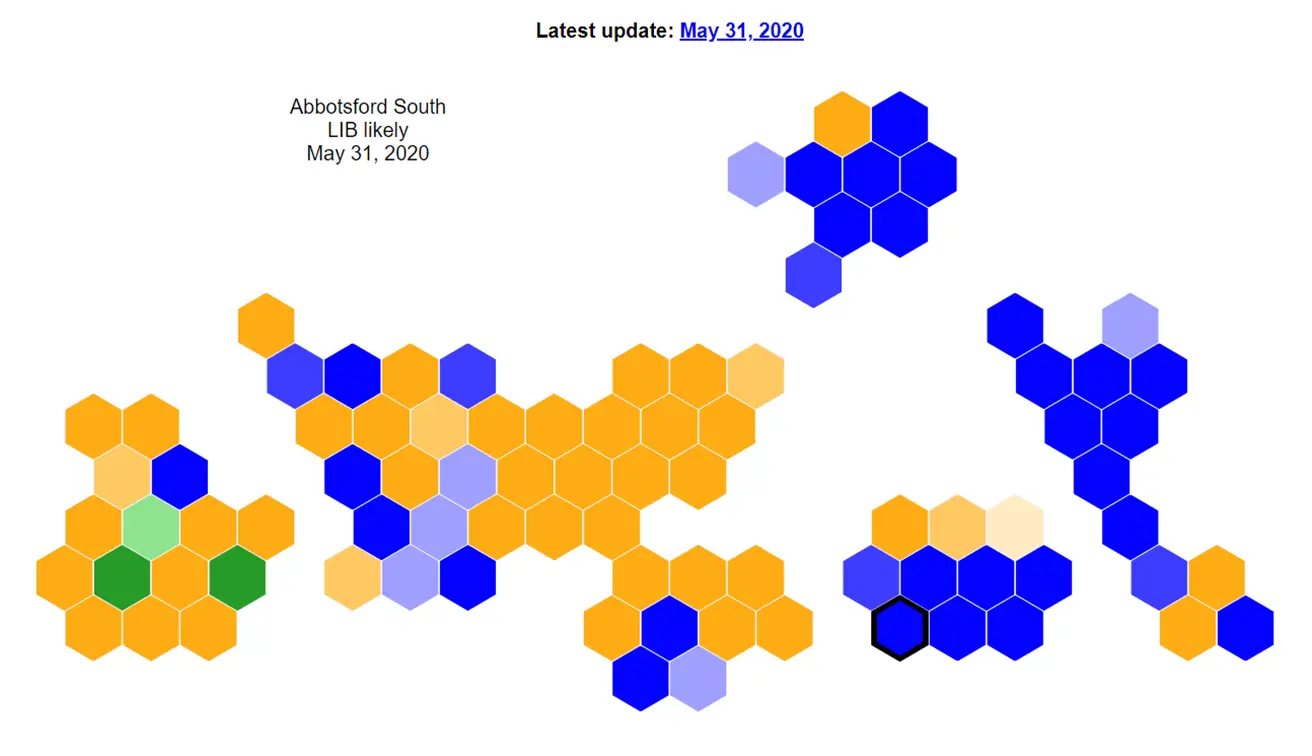
Here is the interactive map of B.C. electoral districts, where you can hover over a district to see the projection, or click on a district to open the district page:
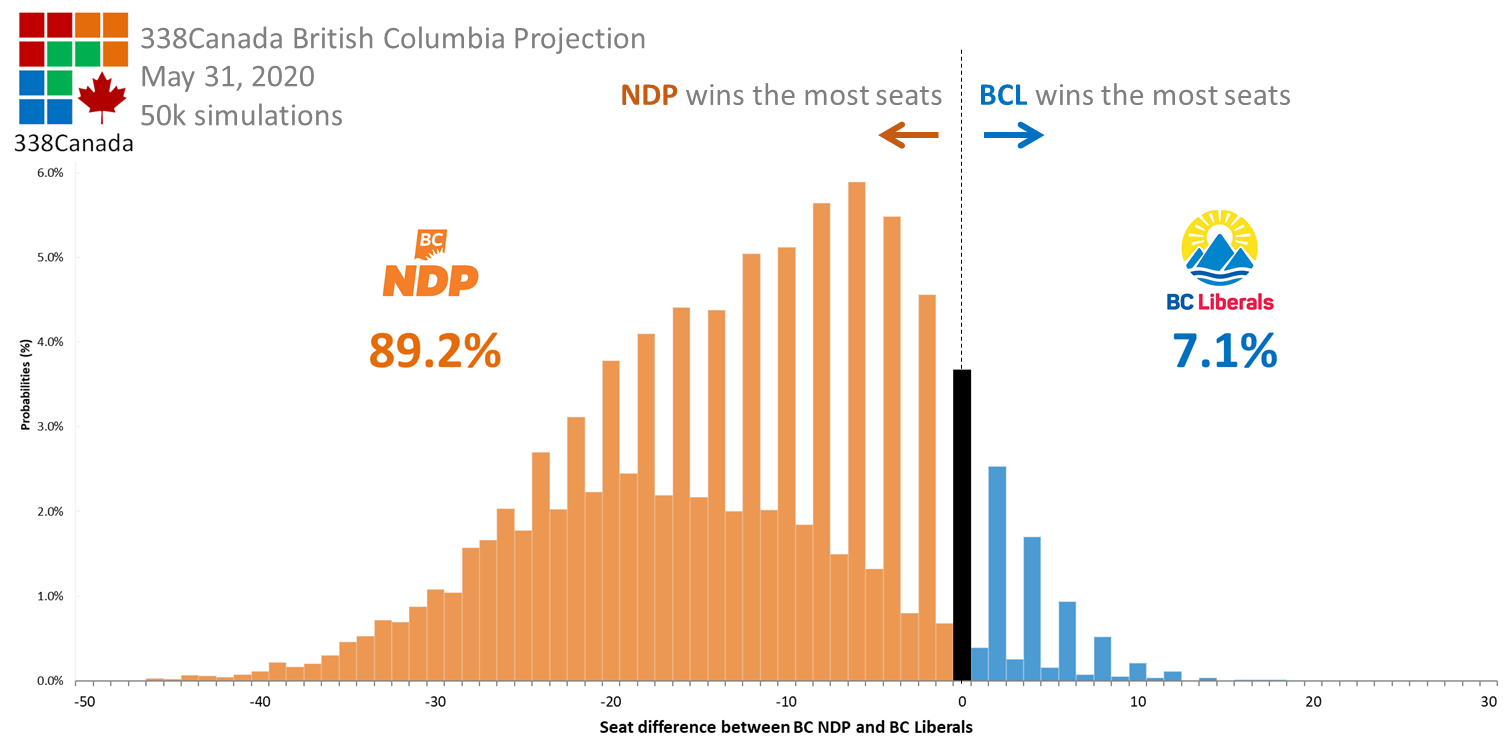
Here are the seat projection probability densities for the NDP and Liberals. The curves still overlap, but as stated above, the regional breakdown of these numbers give a clear advantage to the NDP: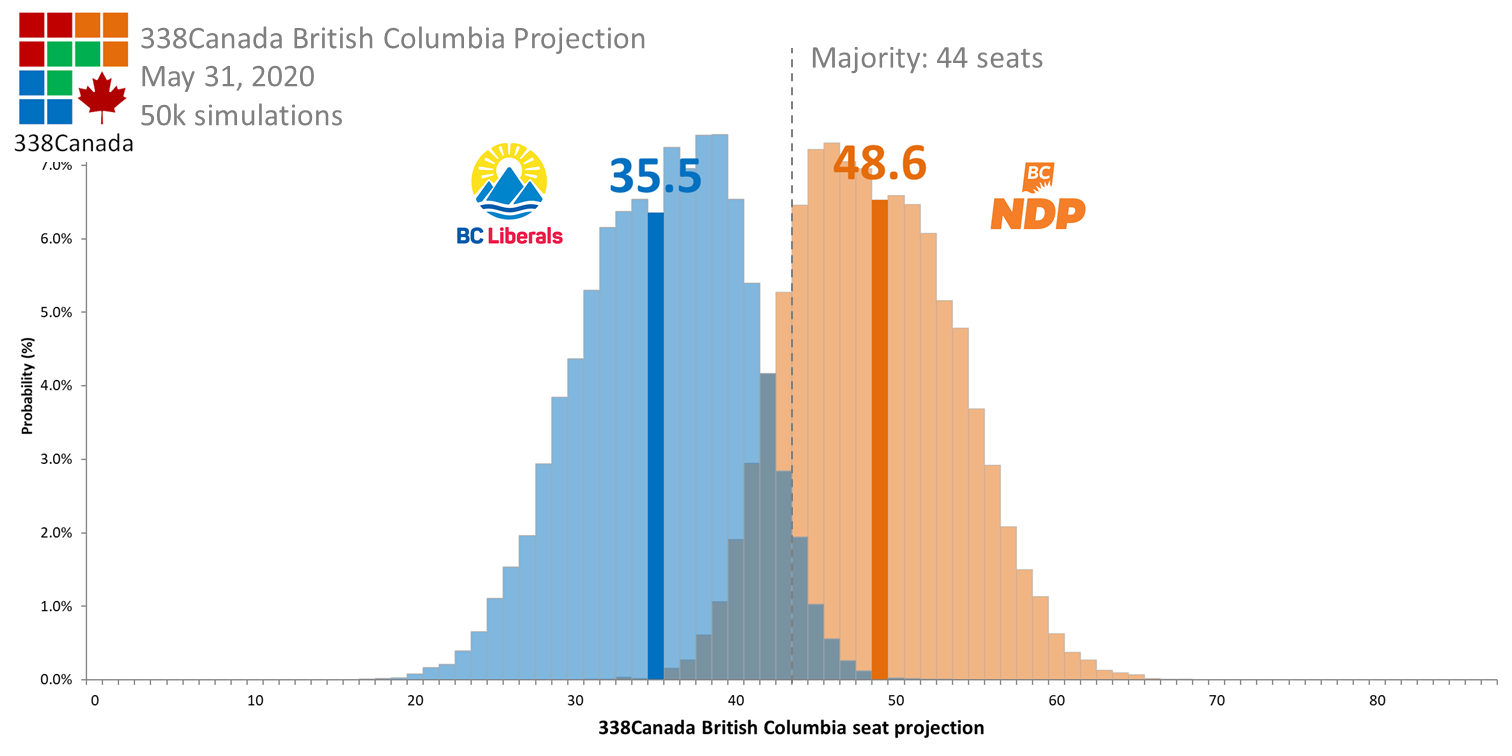
In fact, the model performed 50,000 general election simulations using the latest numbers (and their uncertainty), and the NDP wins the most seats in close to 90% of all simulations. The BC Liberals pull the upset in 7% of simulation (about one in fifteen). Both parties are tied in 4 per cent of simulations, or one in twenty-five.
Here are the projections for all 87 B.C. electoral districts. You may also find your district in the following list:
Thank you for supporting 338Canada. Have a great Sunday.
 Philippe J. Fournier is the creator of Qc125 and 338Canada. He teaches physics and astronomy at Cégep de Saint-Laurent in Montreal. For information or media request, please write to info@Qc125.com.
Philippe J. Fournier est le créateur de Qc125 et 338Canada. Il est professeur de physique et d'astronomie au Cégep de Saint-Laurent à Montréal. Pour toute information ou pour une demande d'entrevue médiatique, écrivez à info@Qc125.com.
As part of its latest round of B.C. polling, Research Co. took the pulse of B.C. voters and has measured the NDP in first place of voting intentions with 41 per cent. The BC Liberals were second with 33 per cent. Regionally, Research Co. has the NDP leading in Metro Vancouver and Vancouver Island by double-digits, and in a close race with the Liberals in the Fraser Valley. See Research Co.'s full report here. (Research Co. has also published several very interesting polls other than voting intentions of late, so I encourage readers to check out their feed - including one recent survey about vaccines.)
Here are the updated 338Canada B.C. popular vote projections:
The NDP has opened some breathing room between itself and the B.C. Liberals, but with the little data that has been made available in the past months, the uncertainty in these projections remain important. However, from the dead heat that was the 2017 provincial election, it appears the NDP support has remained mostly stable - unlike the Liberals -, which gives Horgan and his team an certain edge.
That edge is certainly showing in the seat projections, where the NDP wins an average of 49 seats, five seats above the majority threshold at the B.C. Legislative Assembly. When we break down the numbers by electoral district, the 338Canada model counts 24 ridings labelled as "safe" for the NDP, double the amount of safe seats the Liberals, which gives the NDP the highest floor of seats.
The Liberals win an average of 35 seats in the general election simulations, eight fewer than its 2017 election result. Thte B.C. Green Party is projected ahead in the three electoral districts it won back in 2017 (Cowichan Valley, Saanich North and the Islands, and Oak Bay-Gordon Head).
Here is the interactive map of B.C. electoral districts, where you can hover over a district to see the projection, or click on a district to open the district page:
Here are the seat projection probability densities for the NDP and Liberals. The curves still overlap, but as stated above, the regional breakdown of these numbers give a clear advantage to the NDP:
In fact, the model performed 50,000 general election simulations using the latest numbers (and their uncertainty), and the NDP wins the most seats in close to 90% of all simulations. The BC Liberals pull the upset in 7% of simulation (about one in fifteen). Both parties are tied in 4 per cent of simulations, or one in twenty-five.
Here are the projections for all 87 B.C. electoral districts. You may also find your district in the following list:
- Metro Vancouver
- Greater Vancouver/Fraser Valley
- Vancouver Island/Pacific Coast
- Okanagan/Rockies
- Northern BC
Thank you for supporting 338Canada. Have a great Sunday.
Philippe J. Fournier is the creator of Qc125 and 338Canada. He teaches physics and astronomy at Cégep de Saint-Laurent in Montreal. For information or media request, please write to info@Qc125.com.
Philippe J. Fournier est le créateur de Qc125 et 338Canada. Il est professeur de physique et d'astronomie au Cégep de Saint-Laurent à Montréal. Pour toute information ou pour une demande d'entrevue médiatique, écrivez à info@Qc125.com.